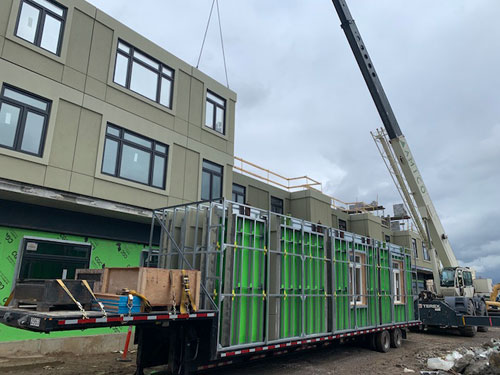
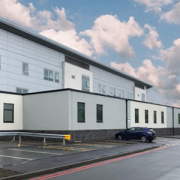
The modular building which will house Wrekin midwife-led unit has been lifted into place at Princess Royal Hospital (PRH) in Telford.

Wrekin midwife-led unit will move into the modular building when work is completed

Wrekin midwife-led unit will move into the new facility, next to the current consultant-led unit at PRH, in the New Year.


Error, group does not exist! Check your syntax! (ID: 2)


The area freed up by the move will be used to create a ward which will cater for acute medical patients, creating more space at PRH over the winter period. The relocated maternity unit will include a birthing pool and en-suite bathrooms.

It has been designed with the leadership team from the women and children’s care group.

The new unit is being provided by a specialist company that has worked with NHS organisations across the country, including the Royal Derby and Milton Keynes University hospitals.

The modular building was installed at the weekend, with a large crane being brought onto the PRH site to lift the components into place.

Wrekin midwife-led-unit (MLU) is 30-years-old.

The Shrewsbury and Telford Hospital NHS Trust, which runs the hospital, says the new facility will be much more appealing to mums wanting a midwife-led birthing experience, while giving women the reassurance of being closer to the consultant-led unit.

The moves have been made possible after £4 million of capital funding was secured from the Department of Health.

Paula Clark, chief executive at SaTH, said: “We are delighted to have secured this funding to improve facilities for mums using our MLU in Telford and to increase our bed space for the winter.

“I know that, to some people, the term ‘modular building’ conjures up images of the old demountable classrooms we had at school, but these modern facilities are about as far removed from that as you can imagine.

“They are purpose-built with state-of-the-art facilities and look fantastic.”


Source: Shropshire Star


Peder Vejsig Pedersen from European Green Cities focuses on Building Integrated Photovoltaics technologies in Denmark


This article presents results in connection with RTD work supported by the Danish EUDP programme and Nordic Innovation funding. Since 2014, there has been ongoing cooperation taking place with the companies Cenergia and Solarplan and Danish manufacturers and suppliers of Building Integrated Photovoltaics (BIPV) technologies to develop new electricity-producing active roofs and facades, where BIPV can be a real alternative to normal roof and facade materials.

Here, completely new and innovative coloured BIPV solutions have made it possible to present roof and facade designs which can be accepted by architects, builders and the general public.

Since 2018, it has been possible to realise a new BIPV Demosite at The Technological Institute in Tåstrup west of Copenhagen, where you can see more than 20 different BIPV solutions in practice. This is an initiative coordinated by architect maa. Klaus Boyer Rasmussen from Solarplan.

At the same time, there has been cooperation with Solar City Denmark and European Green Cities/FBBB, on dissemination work in the form of brochures and thematic magazines.

When it comes to new and innovative BIPV solutions, it is especially relevant to highlight the Danish Solar Energy company, with its HEM-CFR BIPV modules that are produced in 11 different colours and come with a 25-year yield warranty. The coloured BIPV modules have an efficiency which is 85-95% of normal non-coloured PV modules.

Error, group does not exist! Check your syntax! (ID: 6)

At the BIPV Demosite, you can see a BIPV roof solution in the same colour as red tile roofs and a facade design with two light grey BIPV modules placed between two Rockpanel-antrasit facade panels.

Another unique technology comes from the Danish company SolarLab, which delivered 12,000 chromatic blueish BIPV modules for the Copenhagen International School. The BIPV Demosite demonstrates tilted BIPV modules for facades or gables.

It should also be mentioned here that the Danish company Solartag can deliver BIPV modules that exactly matches roof or facade modules from the Norwegian company STENI.

The company VELUX also has an interesting BIPV solution presented at the BIPV Demosite. It is the VELUX Modular Skylight roofing system, that can be purchased with integrated monocrystalline PV modules.


Source: Open Access Government

What construction tech trends should you keep an eye on in 2020? These 7 might be the most exciting.

What are the current trends in the building market?

We’ll expand on a few of these later in the article, but according to sites like ESUB, here are some of the most notable tech trends in the construction industry at the moment: –


Technology Advancements and Integration.

Green Technology in Construction.

Increase in Modular and prefabricated Construction Projects.

Increasing Material Cost.

Decreased Labor Force.

Better Safety Equipment.

Sustainability.


What technology is used in construction?

Despite the construction industry’s traditional resistance to new technologies, some are making significant strides in rounds. Notable examples include, but are not limited to:


Mobile Technology.

Drones.

Building Information Monitoring (BIM).

Virtual Reality and Wearables.

3D Printing.

Artificial Intelligence.


Here are 7 tech trends you might want to watch in 2020.


  1. Virtual reality (VR), augmented reality (AR) and mixed reality (MR)

These technologies are already making a huge impact on many industries around the world, and the construction industry is no exception. Buildings are becoming ever more complicated, and these technologies are helping architects and construction teams improve designs and detect design errors.

To date, architects and design teams greatly improve building design through interactive design and gesture interfacing. 2020 is set to see this technology’s influence on the industry expand even further.

This could range from errors in HVAC system design or finding missing elements that have been overlooked during the design phase. AR, VR, and MR are also being utilized in the construction industry to aid: –


3D modeling of buildings and structures.

Helping improve and innovate BIM visualization.

It helps provide a permanent record of the building and allows clients to explore designs before construction.

Helping “see through walls” for maintenance workers and service engineers.


  1. 3D printing


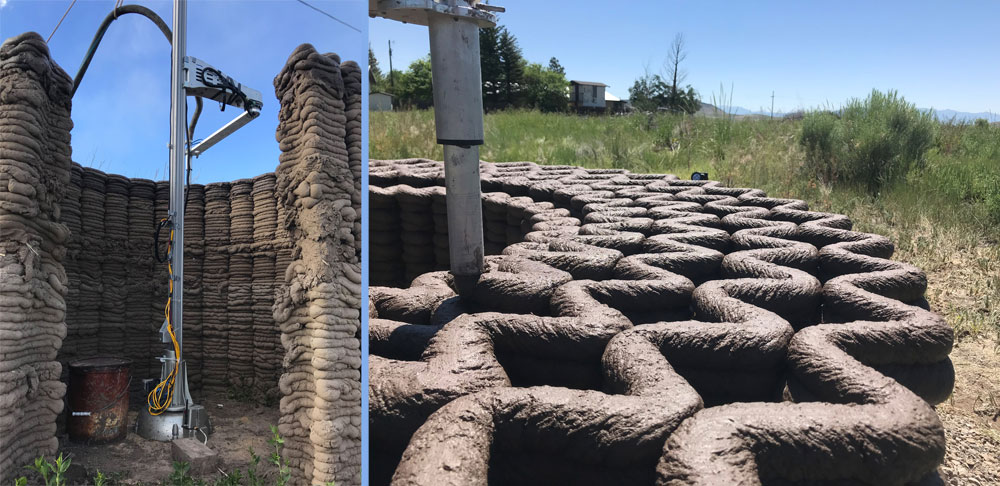
Another tech trend to watch out for in 2020 is the role of 3D printing in the construction industry. The benefits of it have already been explored and exploited by various construction companies around the world.

The ability to either prefabricate offsite or directly on-site has obvious labor and material cost benefits over more traditional building methods. It also reduces waste and being automated is not restricted by construction worker shift patterns.

“The concrete 3D printing market is expected to reach $56.4m in 2021, and with good reason. More and more companies are starting up in the sector to create new, innovative projects. Some are more futuristic, some are very real in the present, such as Apis Cor’s 3D printed house in 24 hours. 3D concrete printing is developing rapidly and relies on different technologies and materials, offering many benefits to its users. The tech is still in its infancy however and is bound by current limitations.” – 3D Natives.


  1. Robotics

2020 may also be the year where robotics makes a bigger impact in the construction industry. Somewhat linked to the impact of 3D printing above, robotics is also seeing impressive infiltration into the industry.

In fact, one report by the World Economic Forum predicted that 2020 could be the year of the robot in the construction industry.

From robotic bricklayers to laying roads, robots are increasingly finding their place amongst the workforce on construction sites. This is interesting as traditionally the construction industry has seen very little automation, relying largely on manual labor.

By adding robots to the workforce, construction companies are seeing improved construction times and improved quality of builds. Robots are also being used to help demolish buildings too.

While currently slower than human demolition crews, they are far safer and cheaper for bringing down concrete structures at the end of its life cycle.

Robots are also being developed to help with certain building maintenance like window cleaning.


  1. Sustainability

For several decades now, building regulations have been placing more and more burden on building design to reduce their environmental impact and sustainability. This is a trend that will only become more strict heading into 2020 and beyond.

Optimized energy efficiency and a drive for low to zero carbon emissions have driven innovation in building construction and service design for years. In response, new, better thermal performance materials are being developed that promise to make the buildings of the future incredibly well insulated for a fraction of the cost of current solutions.

One example from a few years ago was the development of a concrete roof that can generate and store energy. Innovations like this should make buildings of the future cheaper to live in and reduce their impact on the environment.

Reducing waste or recycling old materials is another area where sustainability is helping drive innovation in the construction industry. For example, last year one architecture firm announced its plans for a new method of recycling construction waste into ton new reusable building materials.

It will be interesting to see what new innovations will be realized in 2020.


  1. Modular and Prefabricated Construction


Modular and prefabricated solutions are nothing new to the construction industry. For example, the end of the Second World War saw something of a ‘Cambrian Explosion’ in prefab design in war-torn cities across the UK.

While it has fallen out of favor over the last few decades, prefabs have been making something of a comeback in recent years. The promise of faster on-site assembly and higher quality, standardized builds are seen by some as the solution to tackle perceived housing crises around the world.

“Advances in high-tech design and construction mean increasing numbers of components can be manufactured off-site. That means buildings can go up more quickly and quietly, with fewer materials wasted – an enticing prospect given London’s housing crisis.

To accommodate modular house-building, developers are building their own factories, and architects are getting ever more ambitious in their designs. Here are five of our favorite London modular housing designs.” – The Spaces.


  1. Exoskeletons

Another tech trend to watch in 2020 is the use of exoskeletons. The potential benefits this can afford to a construction site’s workforce are obvious.

Laborers can carry more load than their fragile human bodies would normally be able to cope with, and if it is widely adopted, it would largely increase the safety of construction sites. For construction companies, this will dramatically improve their bottom line by reducing the number of laborers needed on-site as well as reduce lost man-hours from injury.

“ABI Research predicts the robotic exoskeleton market alone will reach $1.8 billion in 2025, up from $68 million in 2014. This year, about 6,000 suits will be sold, mainly for rehabilitation. By 2025, ABI expects to see about 2.6 million on the market.” – Constructible.

But they may ultimately lose out to robots and 3D printing alternatives as exoskeletons still rely on a human operator at their heart. That being said, they might offer the perfect compromise between labor unions who will inevitably try to protect their member’s jobs from becoming obsolete.

But they are yet to significantly infiltrate the industry. Perhaps 2020 will be the year they make it?

Time will tell.


  1. Building information modeling


Building Information Modelling, or BIM for short, is a process of creating and managing information on a construction project from cradle to grave. This intelligent 3D model-based process has already seen wide adoption by architects, engineers, and other construction professionals.

In fact, many local authorities have made BIM the standard for many of its construction project needs. BIM allows stakeholders and suppliers to more efficiently plan, design construct and manage a building and its infrastructure.

As other technologies already mentioned, like AR, and VR, become more popular, their integration with BIM will become ever more important. This is unlikely to slow down in 2020 and beyond.


Source: Interesting Engineering


Landmark hosts pre-election webinar: what the manifestos say about brownfield land, urban development and housing
Monday 9th December – 1PM-2PM

Landmark Information, the leading provider of information to the UK property market, is hosting a special pre-election webinar to compare the major political party manifestos regarding brownfield development, urban development and housing.

The webinar, which is being led by Chartered Geologist and SiLC Paul Nathanail, aims to prepare delegates for the challenges and opportunities the new Government will pose.  The webinar will take place on Monday 9th December at 1:00pm, and will compare all major political party manifestos to determine what the future of property development, redevelopment, planning and housing may look like, with a focus on brownfield land-related pledges.

Error, group does not exist! Check your syntax! (ID: 6)

Paul, who is the Managing Director of Land Quality Management Ltd and also chairs his local Neighbourhood Forum, will also discuss what has changed in relation to Previously Developed Land (PDL) since the 2017 General Election.

Confirms Paul Nathanail: “The major political parties agree that we need to build more homes across the country but many local authorities are struggling to meet their housing targets over the next decade to ensure enough affordable houses are delivered. The Landmark webinar is an ideal opportunity to fully understand what each manifesto means in terms of their commitment to brownfield development.”

Adds Chris Loaring, Managing Director (Legal), Landmark Information: “By hosting the free webinar, we’re providing a plain-speaking, clear interpretation of all political party’s plans with regards to brownfield redevelopment. Brownfield sites will play a big part of the changing urban landscape, to reflect societal needs, and so it’s important to understand policies for the next five years and beyond.”

To register for the webinar, visit https://info.landmark.co.uk/pre-election-webinar.   Or for further information on Landmark Information, visit www.landmark.co.uk.

Read Anthony Kaye’s view on how the construction skill shortage is creating a salary war in the sector.

Recruiting top talent in the construction industry is tough at the best of times, but the shortage of skilled professionals is creating a counter-offer culture that can set key recruitment searches back months.

Property and Construction recruitment specialist Anthony Kaye, of Alderpoint Partners, has seen a surge in counter offers over the last 12 months, with one in three candidates reporting they are being offered an increase in salary from their current employers when they break the news they are moving to a new company.

He says: “Counter offers are one of the biggest barriers developers are facing in hiring people at the moment. It is a candidate-driven industry, and wages are being inflated across the board because developers are keen to keep talent and are willing to match, or even increase on offers.”

The roots of the problem are based in the exodus of talent after the 2007 recession. The construction industry was hit harder than most, with highly skilled surveyors, land managers, civil engineers and sales people leaving permanently to take up roles in different industries.

Compounding this is the lack of training in interview techniques and a failure to address the change into a candidate-short market. Kaye says: “We’ve found there is a big issue with hiring managers having no interview training, which has led to some of our clients asking us to help train their managers in this area and, in some cases, sit in on interviews.”

With a poor pipeline of graduates coming into the industry, coupled with a push to counter the housing shortage crisis in the UK, companies are more likely to try to retain quality employees. So, it’s not just about structuring the interview to ask the right questions, it is also knowing how to sell the new job by ensuring candidates see the positives in a career move.

Kaye explains that a good recruiter needs to help the client do the best sales job they can, by targeting candidates’ real motives and desires for their next role. He says: “During the interview and selection process with the candidates, before they get to the client, we delve deep to find out the key drivers that will turn the candidates head.

“It could be they want flexible working, or a company that will invest in their development and training. Whatever it is, we strongly advise hiring managers to tell recruiters they need to know this before the interview process begins, as it’s vital to help managers focus their sales pitch on what really motivates the candidate’s decision on whether to take the new role and, importantly, stick with that decision in the face of a counter offer.”

He also recommends that clients try to stay close to the candidate during their notice period. He says, “If possible, meet with the candidate and even order which laptop, phone, or car they want, to make them part of the company before they’ve started”.

“Their current employer will likely pull on a candidate’s heart strings to persuade them to stay. So it’s important that the hiring company build a strong relationship with the candidate to help reduce this feeling of guilt in leaving a long standing employer.”

In his experience, an offer of a salary increase can be a first move for current employers to induce candidates to stay, but there are some strong non-salary motivators to move into a new role.

Flexible working hours

The top question candidates ask is whether the role offers flexible working hours. They want to be given the responsibility of managing their own time and diary. It is more appealing to people to work a set number of hours over a week, but with the freedom for them to dictate those hours so they can pick their kids up on a Friday, or take a day off without giving too much notice.

Work-life balance

Gone are the days where people were willing to commute to remote industrial parks for a higher salary. It is now the companies with smart, high-quality offices in easier to reach locations, that are attracting key talent. Candidates are also looking for more inclusive working environments, where there are greater opportunities for networking and social events.

Another key issue is the attraction of modern management methods. Even with a salary increase, traditional office cultures with a dictatorial management style that are being passed over in favor of more professional environments where candidates feel their opinions are valued. In this area smaller developers can compete against larger companies where employees can feel like just another cog in the machine.

Career progression

There may not be a promotion opportunity for candidates in their current company, so this is often an important reason why they would reject a counter offer. However, promotion is not the only career motivator.

Cross-training and learning more about the development life-cycle of a business is a key incentive for candidates. Offering courses and seminars outside the candidate’s immediate skill set is something Anthony is seeing more of as a desirable addition to employment packages.

Additional benefits

Anthony advises to look beyond just the salary, as it’s not always the number one driver. On top of flexible working hours, he has seen an increase in packages that include family health insurance, more holiday time and flexible holidays, incentives at work, summer and winter balls, and gym memberships.

Whilst not all these are necessarily going to combat candidates taking a counter offer, Anthony’s experience shows that a counter offer is not always a long-term solution. For employers it may be cheaper than finding a replacement for key talent, but even if a candidate accepts a counter offer and stays with their current employer, statistics show that within six months they will be back on the market looking for a new job.

“The recruiter and the company need to make sure they highlight the original reasons for wanting to move when considering a counter offer,” says Anthony. “It’s easy for candidates to say they aren’t motivated by money until they get offered another 10K to stay where they are. Usually there are serious underlying reasons for considering a move.”


Source: Showhouse

Walkable cities reduce traffic congestion – an issue that causes around 3.3 million deaths and $121 billion in economic losses every year. But when architects are developing pedestrian-friendly neighborhoods, they often rely on trial and error, intuition or specialized simulations that are hard to use and to incorporate into their designs.

Urbano, a free software launched Oct. 26 by Cornell researchers, employs data, metrics and an easy-to-use interface to help planners and architects add and assess walkability features in their designs as effectively as possible.

“We wanted to create something that would allow architects and urban designers to simulate their designs and get some feedback early in the process,” said Timur Dogan, assistant professor of architecture and lead developer of Urbano. “This lets them make decisions based on facts and data, so they can create the sustainable and livable urban environments of the future.”

Since its launch, Urbano has been downloaded more than 400 times by universities and architecture firms around the world.


Error, group does not exist! Check your syntax! (ID: 6)


The team most recently presented a paper on Urbano in June 2018, at the Symposium on the Simulation for Architecture and Urban Design, and new research is forthcoming in TAD, the journal of Technology, Architecture and Design.

Urbano relies on three metrics to assess walkability: Streetscore, which calculates how streets are used for certain routes; Walkscore, a customizable measurement that rates whether popular amenities are within walking distance of homes and workplaces; and AmenityScore, which considers demographics to estimate the usefulness of various services.

“This is really helpful information for designers doing site analysis,” Dogan said, “because then they can see if there are certain services or amenities missing in neighborhoods, or others that are underutilized or overutilized.”

Assessing walkability early makes it more likely that pedestrian-friendly features will be incorporated, since shifting gears once the process is underway can be costly and complex. And while experienced architects will automatically consider walkability in their designs, Urbano provides simulations backed up by facts and data.

Currently, the research team is working on software that can assess energy use in models of cities, as well as a simulation tool, called Eddy3d, that considers data about urban microclimates. He hopes to eventually create a comprehensive toolkit for sustainable urban design.

The research was partly funded by Cornell’s Center for Transportation, Environment and Community Health, and the Cornell Atkinson Center for Sustainability.


Source: NEWS WISE

Scanning the left side of the Roman Theatre stage with a Faro X330. The two-level column facade was recreated from the remains found on the Volterra site. There were three groups of these two-level columns, part of the scaenae frons (Latin for “stage front”), which was a permanent stage backdrop typical in ancient Roman and Greek theaters.

Not many geospatial professionals enter the field thinking they will travel to Italy to document and digitize ancient sites. For many, it would be the ultimate adventure of combining history and technology—Indiana Jones without the boulders and snakes, and Star Trek without the intergalactic conflict. Three leaders in the Survey/Geospatial Practice of Civil & Environmental Consultants, Inc. (CEC) embarked on such an adventure to the town of Volterra as part of an international research team for two trips over the past three-year period.

Produced by Autodesk and Case Technologies, the humbly named “workshop” is executed through the Volterra-Detroit Foundation, which is a previously established relationship between the city of Volterra and the University of Detroit Mercy School of Architecture. The focus of the workshop was reality capture. New to most surveyors at firms, reality capture is enabled by photogrammetry, which is the use of   photography in surveying and mapping to measure distances between objects. 3D models using photogrammetry can be combined with geographic information system (GIS) visuals such as land surface, roads, and rivers to create more complete georeferenced 3D digital models. These mapped sites can be viewed in a virtual environment.

Digital historical preservation of this kind is important to better document and monitor architectural treasures, especially as they deteriorate over time or are destroyed by natural disasters (earthquakes are not uncommon in Italy, and Volterra is particularly susceptible to landslides). By capturing data every few years, professionals can measure the shifting and deterioration that gradually occur over time. Historical preservation of this nature opens a window into history, ancient engineering and architecture, and archaeology for civilization to reference and enjoy for centuries to come, whether you’re a professional in the field or simply an interested member of the public.

Located approximately 50 miles southwest of Florence, the walled city of Volterra has been continuously inhabited for more than 3,000 years, with historic sites dating back to the fourth century B.C. The historic significance of Volterra is top of mind for Mayor Marco Buselli as he has been actively pursuing a World Heritage site classification from the United Nations Educational, Scientific and Cultural Organization (UNESCO). He knew that gathering data on and documenting the details of this village would likely support (and hopefully accelerate) the application process.


Error, group does not exist! Check your syntax! (ID: 6)


The First Adventure: Racing Against Time to Document and Digitize Volterra’s Ancient Roman and Etruscan Sites
The first workshop in this series was a nine-month endeavor that began in October 2016 with an international team of technicians, software experts, architects, engineers, and historians (a team of eight, representing two countries, U.S. and Canada), and included Rick Celender, CEC’s Corporate Unmanned Aerial Systems (UAS) Program Leader, of the Pittsburgh office; Rob Sinclair, CEC’s Corporate CAD Technology Manager, also of the Pittsburgh office;
and Matt Bainbridge, a survey project manager in CEC’s Bridgeport office. The team was tasked with three assignments: create a digital, interactive 3D model of the city; create Building Information Models (BIMs) for historic buildings and architectural features; and create 3D models of ancient artworks and sculptures.

The primary equipment that Celender, Sinclair, and Bainbridge used for the data capture was a 3DR Drone with a GoPro and two Faro X330 LiDAR scanners.

Terrestrial Light Detecting and Ranging (LiDAR) scanners were used inside historic buildings such as the the Baptistery of San Giovanni and the town hall, where the team captured millions of intelligent data points about everything from the intricate artwork on the ceilings to the tiniest of cracks in a pillar. The points were used to create detailed 3D models of the structures and their features, as well as a BIM, which becomes a useful tool for architects and planners should there ever be a need for maintenance, restoration, or retrofitting. The team also scanned objects in Volterra’s museums.

However, most of the team’s work was done outside.

LiDAR scanners were used to document and digitize Porta all’Arco, the oldest standing Etruscan arch in the world dating back to the fourth century B.C. and the main pedestrian access into Volterra (yes, still used today!).

LiDAR scanners were also used to document a Roman theatre, which alone required 120 individual scan locations to capture the site fully. Constructed in the first century B.C. and originally housing 3,500 spectators, it was excavated in the 1950s and sits just outside the city’s medieval wall.

After reviewing their data, the team found that this particular Roman theatre did not follow the archetypal Vitruvian architectural design that so many other theaters from that time period follow. Individual pieces of the marble decoration, found in various places and often in multiple pieces, were post-processed in 3D and then virtually restored to their original location in the 3D model. The complete catalog of the decoration fragments was developed in collaboration with the Soprintendenza Archeologia in Florence. The 3D model of the reconstructed theater was rendered in 3DS MAX as well as processed in Revit® Live and Stingray software to create a virtual reality (VR) experience that can be accessed through tools such as the Oculus Rift and Samsung GearVR as well as through holographic displays.

A southward panorama of the Roman Theatre site. The theater was constructed in the first century B.C. and had a capacity of approximately 3,500 spectators.

In addition to these notable sites, the team scanned architectural details from around the city using high-resolution digital cameras (and even iPhones, which illustrates the advances of everyday technology) and then converted them to 3D models.Every evening, the team processed data captured during the day, taking the point clouds and creating a mesh, which turns the point cloud into a 3D model. With hundreds of scans to register and drone flights to process into point clouds, the team used multiple software programs and created a workflow akin to an assembly line. Data was collected from scanners and drones by one person and then distributed to two or three people to register. Additional team members would then process the data into 3D models.

“From there, we can take the mesh data and incorporate it into Autodesk® Civil ٣D® or Revit® to create an as-built model,” noted Sinclair. “We can truly recreate the space—put details in, tag it with data, etc. All the measurements of the BIM were based off the point cloud or mesh we created.”

“It was hectic but efficient,” Celender remarked.

After leaving Italy, the team continued the initial nine-month adventure analyzing and modeling the captured data. In June 2017, some team members from the workshop returned to Volterra with a few interactive models and 3D-printed replicas for a presentation in the town hall. The team treated Mayor Buselli, his staff, city residents, and representatives from UNESCO to a virtual reality (VR) demo that mimicked walking through Volterra’s historical sites, including a chance to experience the fully recreated Roman theatre in its original glory. The public was invited to experience the models throughout the following month.

The processing of data continued in the months that followed the workshop. The models of the museums’ artifacts began to be used in virtual exhibitions, for research, and for conservation efforts, with the option of being replicated using 3D printers for educational purposes.


The SECOND Adventure: The First Ancient European Amphitheater Discovered in 150 Years Teaches an Important Surveying Lesson

In April 2019, the workshop reunited for a second trip which lasted for two weeks. New construction in Volterra had inadvertently unearthed evidence of more ancient architecture. Incredibly, what was identified as the remains of an ancient Roman wall turned out to be the first ancient amphitheater discovery in Europe for the past 150 years.

This time around, the Workshop team was significantly expanded, consisting of 15 members from eight countries and included Sinclair and Bainbridge (Celender was unavailable due to other project commitments). The primary equipment employed included two UAVs: the DJI Phantom 4 Pro and the DJI Mavic Air; six pieces of LiDAR equipment: the Leica Pegasus Backpack, two Leica RTC360 scanners, two Leica BLK360 scanners, and a Faro X350 scanner; various cameras, including a Ricoh Theta 360 Camera and a Matterport camera; a Leica Viva GS16 GPS system; three VR systems: an Oculus Go, an Oculus Rift, and an HTC Vive; and a Hexagon Geosystems Stream C ground-penetrating radar unit (GPR).

Bainbridge’s role was performing terrestrial laser scanning (using the phase-based Faro laser scanner as well as Leica BLK360 and RTC360 time-of flight scanners), establishing geodetic control with the Leica GS16 GNSS receiver and Leica Infinity software for areas scanned throughout the workshop’s tenure, and kinematic LiDAR capture of the Volterra streets using the Leica Pegasus Backpack with Simultaneous Location and Mapping (SLAM) technology. Sinclair’s primary role was capturing aerial mapping data via drones with mounted cameras. They uploaded point clouds to Cintoo, which triangulated that data and turned it into a solid. Team members then moved that data into Civil 3D® and Revit® to create models.

“It was surprising how accurate the point clouds from the UAV cameras were using photogrammetry when compared with precise ground-based LiDAR scanning,” Sinclair commented.

Unfortunately, due to significant ground moisture and depth of the ruins, the GPR scan results were not as successful, leaving much of the unexcavated extents discernible only by the surface topography.

“Surveyors always say we don’t have x-ray vision—GPR didn’t change that in this case,” Bainbridge commented. “One of the most difficult things we run into in the surveying profession is determining the location of things that we can’t see.” This served as a healthy reminder that surveyors don’t always get all of the data they’d like.

However, this second trip certainly wasn’t in vain. In addition to the data capture and modeling of the amphitheater, the Workshop completed subsequent scans on many of the same historic features from the first trip. Not only is the team documenting these artifacts and ruins in ways that allow the public to interact remotely through VR platforms such as Matterport, Cintoo, and Unreal, but the team has been able to make real data deliverables; for example, using the team’s laser scan information, Sinclair and Bainbridge produced a Civil 3D® surface and cross sections of the amphitheater, which allowed the city engineer to assess existing drainage structures and plan for upcoming excavation work.


What’s Next?
Many of Volterra’s historic sites are now digitized. The Roman amphitheater is currently on the “Tentative List” for Heritage Site classification from UNESCO.

“The opportunity to collaborate with an international team of architects, engineers, historians, and students to digitally record Volterra’s architectural history from the first century B.C. was amazing,” Celender remarked. “The support we received from Mayor Buselli was critical in our efforts. The access we had to the city, the Roman theatre, etc., to fly drones and to perform scanning missions was incredible. The wine and grappa [a grape-based brandy] were pretty memorable, too!”

“One of the most rewarding parts of this project has been using data we’ve captured to benefit the ongoing preservation efforts in Volterra,” Bainbridge said. “It’s easy to get caught up in the photo-realism of reality capture data and gloss over the fact that all of those beautiful colorized data points are actually survey-grade measurements. Before this workshop, my experience with GPR and magnetic line location had been in determining the approximate locations of utilities; I had never thought of applying this technology in the field of archaeology. We’ve come pretty far compared to the old days, which wasn’t actually that long ago—the days when surveyors made calculations in a notebook without the use of a calculator, and wrote down angles. Look where we are today!”

This advanced technology—and this team’s novel yet crucial use of that technology—is quickly becoming a game-changer in our industry.


Source: American Surveyor

The global modular and prefabricated buildings market is set for growth over the next six years, as offsite construction gains traction thanks to its sustainable approach, according to Frost & Sullivan’s recent analysis

A global uptick in construction activities and significant cost, labour, and time savings in offsite construction are key factors driving market revenues toward $215bn (£167bn) by 2025.

With a constantly evolving regulatory landscape, adopting more environmentally sustainable and regulatory-compliant construction practices will boost prospects and revenues in the more mature markets of Western Europe and North America. Frost & Sullivan expects the market to expand at a sturdy CAGR of 6.3% from 2018-2025.

Prathmesh Limaye, senior analyst of chemicals & materials in infrastructure & mobility at Frost & Sullivan, said: “Despite increased construction costs from an offsite construction, a net saving of up to 7% is possible because of shortened construction periods.

“In addition, prefabricated buildings are increasingly being perceived as sustainable solutions for construction projects due to a growing usage of materials, such as timber and aluminium composites, that are more energy-efficient than concrete.

From a regional perspective, the recovering economies of Latin America along with high-growth markets of Eastern Europe, India, and Southeast Asia are expected to provide lucrative market opportunities. Slower growth is anticipated in North America and Europe due to increased construction activities in developing regions.

From a competitor position, the market is highly fragmented with several regional and smaller suppliers with wide market coverage due to the relative ease of setting up a business in this space. The offsite construction industry is, therefore, slated to experience consolidation with multiple merger and acquisition activities occurring in the foreseeable future.

Error, group does not exist! Check your syntax! (ID: 2)

Limaye added: “Many small and regional participants influence the overall pricing and distribution patterns in regional markets, especially in Latin America, the Middle-East, and Asia-Pacific.”

To gain a competitive advantage, Limaye recommends players emulate innovative companies such as Katerra and Welement, and adopt automation and design tools to increase the quality and precision in their construction.

Additional growth opportunities participants should aim to secure include:

  • Manufacturers promoting more cost-effective and environmentally sustainable solutions that are compliant with regulations mandated by international organisations.
  • Gaining wider coverage by improving their portfolios with products that can be customised to end-user specifications and also promote ease of installation.
  • Expanding operations into high-growth regions such as Asia-Pacific due to the region’s growing infrastructure and construction development.
  • Offering products that are comparative with those offered by regional and local manufacturers.

Limaye concluded: “Despite significant market expansion prospects, perceptions surrounding the high initial cost of construction and transportation, design rigidity, multiple stakeholder involvement, and lack of skilled labour are key factors slowing adoption rates and hindering market growth.”


Source: PBC TODAY


Recently, headlines were made when an Australian team published a study finding that there was more than enough pumped hydro storage resource locations to satisfy all future needs for storage in a 100% renewable grid. As the global resource map site hosted at the Australia National Museum says:


“We found about 616,000 potentially feasible PHES sites with storage potential of about 23 million Gigawatt-hours (GWh) by using geographic information system (GIS) analysis. This is about one hundred times greater than required to support a 100% global renewable electricity system.”


In other words, we only need to use about 1% of the global pumped hydro resource locations to satisfy our needs. Furthermore, pumped hydro can store energy for weeks and the round trip from electricity to elevated water to electricity is 80% to 90% efficient. It’s already by far the largest form of utility-scale storage in the world, with more than 160 GW of rated capacity of pumped hydro in operation as of the end of 2016.

NREL published a report on the value of pumped hydro in 2018 that’s worth quoting a couple of bits from:

“PSH is a highly flexible, low-marginal-cost, and fast-acting generation asset, and in the market simulations, it was shown to reduce system-wide operational costs in both the day-ahead and real-time markets”

“In all market simulations, the addition of PSH significantly reduced the annual operating costs for the test system. Cost savings ranged from 1.2% to 2.8% in the day-ahead market simulations and between 3.9% to 10% in the real-time simulations.”

Sounds like we have a winner. It’s a rock solid technology, first deployed in the 1890s. It may be dull, but it works, it’s simple, and it’s effective. It saves money on the grid. And as the Australian study showed, there’s absurdly more of the resource than we possibly need.


So why are there regular claims that pumped hydro won’t suffice?


I published The Short List Of Climate Actions That Will Work, and pointed to pumped hydro as a primary storage mechanism that needed to be developed. Comments on that piece included derogatory comments about pumped hydro. Similarly, in my assessment of the climate action plans of the leading Democratic candidates, none call for pumped hydro, but for more R&D into storage, with the intent to reduce costs below battery storage. Since pumped hydro is already below battery storage costs, it’s a head-scratching situation.

Recently, a South African representative of an innovative company in the space reached out to me based on my piece, Joi Scientific’s Perpetual Hydrogen Illusion Comes Tumbling Down. As with many of my clients, the company wanted an independent read on its technology to understand how it fits and whether they are missing something in their analysis.

The premise of their innovation is straightforward. If you use a big rock or concrete plug in a shaft full of liquid, you can use pumped hydro technology to move the plug up and down. Imagine a missile silo that’s generating electricity, instead of hiding an ICBM. This allows a much bigger weight with fewer mechanical construction challenges. I did a little due diligence to see if there was any way that I could add value. I reviewed their material, their patent, asked a few questions, and realized that their solution was solid.

The discussion triggered me to think about the Boring Company and Tesla Energy, and the characteristics of Tesla’s Powerpack battery solution. It’s an excellent same-day solution for fast response energy, but the characteristics that make it good for duck curves with solar don’t make it good for longer lasting storage. It’s getting cheaper, but it’s still not a cheap form of larger scale storage.

When I did an assessment of the viability of a large-scale, carbon-neutral, secure greenhouse in Canada for a client this year, the Powerpack component of the solution was the most expensive portion if the solution had to remain off grid, and that solution included a 100,000 sq ft high-tech greenhouse, 3 MW of LEDs, a few acres of solar panels and a very big ground-source heat pump, all of which are capital intensive components by themselves. Powerpack’s 4-hour efficiency is 85%, but it’s not so good at 72 hours.

I asked Jim Fiske, the founder and CEO of Gravity Power and the person whose name the patents are in, about the Tesla connection. They had had conversation with Musk about this, but among other things, the shaft diameter that the Boring Company drills are too small for economically viable models.

“The net result of all these considerations is that very large Gravity Power Plants (multiple gigawatt-hours) are extremely cost effective, while very small ones are generally not cost competitive. When I say “cost effective,” I mean the levelized cost of GPP storage is roughly five times lower than li-ion battery plants.”


Error, group does not exist! Check your syntax! (ID: 2)


Between the conversations and the publications, I decided it was time to go deeper on the global study that had come out of Australia recently. Among other things, I was curious to see if it was another example of machine learning in the climate solution space, something I’m digging into as a series leading to a formal CleanTechnica report. The peer-reviewed paper on the global study isn’t out yet, but it’s an extension of an Australia-specific study published in 2018. That study is Geographic information system algorithms to locate prospective sites for pumped hydro energy storage by Lu, Stocks, et al., in the journal Applied Energy.

I realized quickly that there was a disconnect between how most people think of pumped hydro and what the study was saying, a disconnect that might be leading to dismissal of pumped hydro as a large-scale solution.

Outside of interesting innovations such as Gravity Power, there are three types of pumped hydro. One of them has characteristics that mean that it can take 15 years to gain approvals and build. Two of them don’t share those characteristics and are much faster to approve and build. The study focused specifically on the latter two, meaning that the 100x more resource than required is specifically for easier to site and faster to develop resource. That’s a very good news story.

Let’s look at the first type of pumped hydro, open-loop, to gain an understanding of the challenges. That form of pumped hydro is continuously connected to a naturally flowing water feature. That means building a dam, creating a large reservoir, and diverting water that flowed through the environment to power generation. That has a large number of environmental impacts, and is also highly subject to strong pushback from the public downstream and upstream of the facility, who typically and reasonably like the water flowing the way it is and the land unsubmerged. The large majority of the 160 GW of pumped hydro storage that exists today is open-loop.

That’s the form that takes 15 years to build, if it manages to get built at all.

However, the authors of the study focused on two types of closed-loop pumped hydro, dry-gully and turkey-nest.

 
Image RE100 Group Austrailian National University


The top diagram shows a dry-gully pumped hydro siting. As the name suggests, this is a land feature that is suitable for damming, but one that has no water running through it. As such, upper and lower reservoirs can be created and filled without impeding water flow, damaging streams or damaging habitat and wildlife that depend on the flowing water.

The bottom diagram shows the turkey’s-nest pumped hydro cross section. It’s called that because turkeys make their nests on the ground, building up the sides. The turkey’s-nest option is suitable for flatter land, where a dry gully doesn’t exist. Flatter doesn’t mean flat as a pancake of course, but one with a gentler decline from a higher elevation to a lower elevation, so that two turkey’s nest reservoirs can be excavated, the earth used to build up the walls and connected with a bored tunnel for two-way flow of water.

The study’s authors refer to this type of pumped hydro as short-term off river energy storage (STORES), and their modeling is based on this. They explicitly looked for resources with excellent characteristics for rapid development.

“STORES is located away from rivers and has little impacts on the environment and natural landscape due to: (1) no interaction with the ecosystem of main stem rivers, (2) no conflicts or competition with nature reserves and intensive land uses and, (3) medium-sized reservoirs located within close proximity to electricity infrastructure and renewable energy resources.”

Being in British Columbia, I’m familiar with reservoir sizes for hydroelectric sites, and know that they are very big indeed. The 800 MW capacity Site C Dam that’s being developed in northeastern BC on the Peace River near the border with Alberta, for example, will have a reservoir that’s 93 square kilometers, or 36 square miles. That’s an area that would cover most of San Francisco, and one that’s quite a bit bigger than Manhattan for perspective. It’s a fifth the size of Lake Tahoe.

The reservoir needs to be that big to enable a sufficient head — the vertical distance between intake and discharge  — for effective generation. When most people think of hydroelectric, that’s what they think of, huge reservoirs that inundate a lot of land that often had people, culturally significant elements, or agriculture on it, lots of concrete, and a downstream that’s radically altered. But that’s not what STORES is.

“PHES system with twin 100 hectares (ha), 1 gigalitre (GL) reservoirs separated by a height difference of 500 m is able to contribute 1 gigawatt-hour (GWh) of storage capacity (assuming an usable fraction of 85% and an efficiency of 90%), or 200 MW of power with 5 hours of storage to the electricity system – equivalent to a large gas-fired power plant.”

They looked for very high-head sites, where the vertical head makes a big difference for the amount of energy that can be stored. After all, it’s a gravity system, and the higher the head, the higher the potential energy of water. It takes more energy to lift a kilogram 10 meters than 1 meter, and you get more energy back.

The minimum head that they looked for in the study was 300 meters. Site C, for comparison, has a 50-meter head. That means that the reservoirs can be a lot smaller. The example above, at 100 hectares for each reservoir, is only a square kilometer or about 0.4 square miles. That’s a tenth of a percent of the size of the Site C Dam reservoir. That’s less than a third the size of Central Park in NYC or a quarter of the size of Golden Gate Park in San Francisco. The dam walls were modeled at a maximum of 40 meters (130 ft) for the dry-gully sites and 20 meters (65 ft) for the turkey’s nest sites. These aren’t trivial structures, but for comparison, the Oroville Dam in California is 234 meters (770 ft). By hydroelectric standards, they are modest.

So these are small reservoirs that don’t block rivers or streams, that are sited away from nature reserves and parks, that are sited near transmission lines, that are sited near high renewable energy resource areas and are capable of providing GWh capacity storage. The round trip efficiency is 80% to 90%, and storage can be for days or weeks, although typically its most economical for next day grid balancing per the NREL study. This contrasts to Tesla’s Powerpack which is currently very effective at in-day balancing, soaking up mid-day solar for end of day peaks.

There are two observations. The first is that siting approval for sites like this should be a lot faster and less controversial than for hydroelectric dams in general. Among other things, I wondered if the global siting study was able to have access to detailed data on sensitive or preserved natural areas of the same quality as the Australian study. I reached out to one of the study’s primary authors, Matt Stocks, and he told me:

“We use the World Protected Area Database for environmental exclusions. We haven’t had any issues with this brought to our attention. The land use is more difficult.  Our only land use exclusion is regions of high urban density.  It is not perfect with a number of smaller towns around he world inundated.”

I was reassured that the environmental approvals would not be challenged outside of Australia. The smaller town challenge should be trivial to resolve given that there are 100x more sites than required, so as the resource database is assessed by countries, they can eliminate sites with towns using country data. There’s also a proviso in the online mapping resource that geological, tectonic, and engineering work still needed to be done to validate each potential site. Many won’t be viable for reasons of slope stability and the like.

I was also curious if he had a perspective on whether siting approval was faster with STORES.

​”The individual states in Australia manage the main approvals and have regulatory responsibility for the electricity system.  NSW has released a pumped hydro road map and SA are supporting a number of proposals there.  The approval processes for wind and solar have been significantly streamlined through the states formalising the approval process and this appears to be emerging in Australia for pumped hydro.

In other words, yes. Standardizing on STORES gets us on track and allows streamlined approvals. Since we need a lot of movement by 2030, this is excellent news and something that’s replicable in every country.

Is it enough for the US? Well, what are the requirements? Per ANU:

“An approximate guide to storage requirements for 100% renewable electricity, based on analysis for Australia, is 1 Gigawatt (GW) of power per million people with 20 hours of storage, which amounts to 20 GWh per million people. This is for a strongly-connected large-area grid (1 million km2) with good wind and solar resources in a high-energy-use country.”

And what is the resource size for the United States? The study shows that the United States has about 4,500 GWh of potential STORES sites per million people, over 200 times what is expected to be required.

And those stores are close to major population centers for the most part. If some of the flatter states would like pumped storage, Gravity Power is happy to oblige. They are excellent for flat land siting and have even lower environmental impact concerns than STORES.

What else is true about a lot of those locations?

There are a lot of coal workers in those regions who know how to work rock. Building pumped hydro is strongly aligned to their technical and engineering skill set. And there are 60,000 or more of them who want good work, and would prefer it be not too far from where their families are. I keep suggesting that Democratic candidates should make this a campaign plank, but I haven’t seen any uptake yet. I’ve asked this question of Ike Kirby, PhD and Kamala Harris’ environmental policy advisor, but haven’t had a response yet.

But back to Elon Musk. As I pointed out earlier, the Boring Company isn’t well suited for Gravity Power’s large-diameter shaft requirement. But what about closed-loop pumped hydro as identified by the STORES study? Pumped hydro requires tunnels, not a huge shaft. The tunnels range from 4.5 to 8 meters per existing sites and a Springer study.

What does the Boring Company do? It bores 4.3-meter finished shafts. What does Tesla Energy do? It does energy storage. Start at the bottom, point the Line-Storm upward to the upper reservoir, start it up and use the resulting tunnel rock and soil in the earthen bulwarks of the reservoirs. What else is good for closed-loop pumped hydro? Covering material of some sort to reduce evaporation so that you don’t have to top them up that often, which strikes me as an excellent use case for Tesla’s commercial solar panels, floating on the placid waters of the upper and lower reservoirs. Seems like a no-brainer. So I reached out to Elon.

No response yet. If he does respond, I’m sure that will make for an interesting discussion.

Closing off, when I started reading the detailed study, I was curious to see if the approach used took advantage of machine learning or not. And it doesn’t. It’s a geographical algorithmic search process that first excludes a bunch of areas first, then does specific calculations about potentially viable spots. It’s computationally intensive, but using classic techniques, not neural-net techniques. This isn’t to say it doesn’t embody a good deal of insight and innovation, just not that specific type. I asked Matt Stocks why machine learning hadn’t been used for this particular solution.

“Machine learning works really well for large data sets where the machine learning algorithms can learn from one set of data and extrapolate to another. I don’t think there are sufficient examples of closed loop schemes to be able to train the algorithms. And once there is a reservoir there, we can’t see what the land underneath it looks like anymore since the elevation measurements will refer to the water level instead of the ground.”

This aligns well when compared to the CoastalDEM machine learning effort I covered recently which found much larger coastal risk of extreme water levels than had previously been understood. That study had both a global NASA SRTM dataset equivalent to what Stocks et al. used, but they also had a high-quality set of lidar data readings for much of the United States and Australia’s coastline to train it with. The number of existing dry-gully and turkey’s nest pumped hydro sites is small and there’s no equivalent to the lidar data set to correct the elevation and find similar features elsewhere.

So there we have it. Pumped hydro is a highly viable storage technology, it overlaps nicely with the characteristics of Tesla’s existing battery technology, the Boring Company has high-speed tunneling equipment suitable for penstocks, and there are a lot of excellent coal miners who could be repurposed close to home in the United States. Seems like a winner to me indeed.

About the Author

Michael Barnard is Chief Strategist with TFIE Strategy Inc. He works with startups, existing businesses and investors to identify opportunities for significant bottom line growth and cost takeout in our rapidly transforming world. He is editor of The Future is Electric, a Medium publication. He regularly publishes analyses of low-carbon technology and policy in sites including Newsweek, Slate, Forbes, Huffington Post, Quartz, CleanTechnica and RenewEconomy, and his work is regularly included in textbooks. Third-party articles on his analyses and interviews have been published in dozens of news sites globally and have reached #1 on Reddit Science. Much of his work originates on Quora.com, where Mike has been a Top Writer annually since 2012.


Source: CleanTechnica

Two industry reports, published today, suggest that Brexit is not wholly responsible for the slow down in construction projects, but rather the quite reversal of louder government project announcements.


MINERAL PRODUCT ASSOCIATION

Following a broad-based weakening in the first half of 2019, construction market demand for mineral products, including aggregates, asphalt, ready-mixed concrete (RMC) and mortar, improved in 2019Q3 compared to the previous quarter. Growth in mortar sales was the strongest, up 5.2% compared to 2019Q2, followed by asphalt (4.1%), aggregates (2.7%) and RMC (1.4%).

Whilst welcome, this improvement has not been sufficient to lift the market performance for 2019 so far. In the first 9 months of the year, markets for asphalt and mortar remained broadly flat compared to the same period in 2018, while sales of aggregates and RMC declined.

The Office for National Statistics (ONS) estimates that construction output increased by 2.6% over Jan-Aug 2019 compared to the same period in 2018, with growth driven by housebuilding and new infrastructure work. Work on commercial sites, including retail and office buildings, continues to decline. Aggregates and RMC are ubiquitous to any type of construction work, and are usually used early in a construction project timeline. Hence, given the weakness of these markets, it suggests that recorded construction output reflects continuing activity on existing sites rather than new sites.  Following two years of subdued mineral products market conditions in 2017 and 2018, flat to negative sales volumes this year are precursors to a further slowdown in construction in the near term.

Despite initial expectations of work planned to pace up on Highway England’s roads programme this year, asphalt sales volumes saw a marginal decline by 0.6% over Jan-Sept 2019 compared to the same period in 2018, with falls particularly pronounced in the South West and East Midlands. The Mineral Products Association (MPA) members continue to report significant delays to the Road Investment Strategy (RIS 1) delivery. Highways England has now indicated that 37 of the 112 projects set to be carried out over 2015-20 have now either been pushed to the next Road Investment Strategy (RIS 2), covering 2020-25, or put on hold altogether for review. Of the 75 remaining projects to be delivered by the end of FY2019/20, 30 are planned to start during the current financial year, mostly in 2020Q1. Given past delivery records, the industry has little confidence in Highways England’s capability to ensure these projects are delivered as planned.

Simultaneously, the RMC market remains decisively weak and is heading for a third consecutive year of decline in 2019. Sharp declines in sales volumes continue to be recorded in both London and South East, which together account for a third of the total (GB) market. The general decline is closely tied to falling investment in commercial buildings, which have been impacted by the ever-increasing domestic uncertainty surrounding Brexit and the economy. It also reflects slower housebuilding activity in the capital.

Mortar sales are a straight forward indicator of housebuilding activity, especially in regions outside London where constructions are more likely focused on ‘bricks and mortar’ rather than high-rise towers. After a year of consecutive quarterly falls, mortar sales volumes resumed growth in 2019Q3, up 5.2% compared to the previous quarter. Yet again, the annual trend for 2019 remains weak: sales volumes increased by just 0.4% in the first 9 months of 2019 compared to the same period in 2018, a significant slowdown from two years of double-digit growth in 2017 and 2018.

Current construction forecasts, such as from the Construction Product Association, suggest housebuilding will pick up again from 2020, given continued support from Government’s Help to Buy scheme. Weakness in the commercial sector is expected to remain until at least 2021, as investment in the sector is being hindered by the ongoing Brexit negotiation process. More realistically, any growth prospects for construction and its supply chain is more dependent on what happens in infrastructure. If delivered as planned, major infrastructure projects in roads, rail and energy should boost activity on the ground over the next few years, but concerns are rising over the delivery of these projects, notably in the rail and road subsectors. The government-commissioned review into HS2 is likely to add further delays to a project already beset by them, whilst work on RIS1 looks unlikely to be delivered as planned, even after the revisions made by Highways England.

Aurelie Delannoy, Director of Economic Affairs at the MPA, explains: “Government cannot overestimate the significance of the current infrastructure pipeline of work for both construction and its supply chain, and for the UK economy as a whole. At a time of great reckoning for the UK’s political and economic future, repairing local roads, building houses, schools, hospitals, and upgrading major rail and energy networks provide the means to lift both short-term and longer-term productivity and growth prospects. It is a great opportunity to put our own house in order.”

“Government often asks how they can help businesses; the answer is simple: provide clarity over future policy and investment and stick to it. Regardless of any Brexit outcome, it is in the power of the UK Government to ensure planned infrastructure investments are being delivered in a robust and timely manner.”


IHS MARKIT / CIPSUK CONSTRUCTION PMI®

October data pointed to a sustained decline in UK construction output, with overall volumes of work falling for the sixth consecutive month. The latest survey also revealed a sharp drop in new work, although the rate of contraction was the slowest for three months. Meanwhile, construction companies continued to reduce their workforce numbers in October, which was linked to weak order books and concerns about their near-term business outlook.At 44.2 in October, the headline seasonally adjusted IHS Markit/CIPS UK Construction Total Activity Index registered below the crucial 50.0 no-change threshold. The latest reading was up from 43.3 during the previous month, but still close to the ten-year low seen in June (43.1). Construction companies noted that client demand remained subdued in response to domestic political uncertainty and the economic backdrop. In some cases, survey respondents noted that unusually wet weather in October had acted as an additional headwind to construction output. Lower volumes of work were recorded across all three broad categories of activity. Civil engineering was the worst-performing area, with business activity falling at the sharpest pace since October 2009. House building also decreased at a faster rate in October. Latest data pointed to the greatest drop in residential work for over three years. At the same time, commercial construction fell for the tenth month running, but at the slowest rate since May. New orders dropped for the seventh month in a row during October, but the rate of decline was the least marked since July. Construction companies noted that clients continued to defer decision-making on new projects in response to political uncertainty and concerns about the economic outlook. Survey respondents also suggested that intense competition for new work had resulted in more widespread price discounting to secure contract awards. Softer demand conditions and a lack of new work to replace completed projects resulted in another fall in staffing levels across the construction sector. Employment numbers have declined in each month since April, which survey respondents mainly attributed to the non-replacement of voluntary leavers. Input buying dropped again in October, but weaker demand for construction products and materials did not prevent a further lengthening of suppliers’ delivery times. The latest downturn in vendor performance was the sharpest since June, with construction firms commenting on stock shortages among suppliers (especially plasterboard and insulation materials). However, input cost inflation was the lowest for just over three-and-a-half years.Meanwhile, business optimism towards the year-ahead outlook for construction work remained among the weakest seen since 2012. Some construction firms noted that contract awards related to large-scale civil engineering projects had the potential to boost workloads in the next 12 months, although political uncertainty continued to cloud the outlook.